- Accidental DBA
- Posts
- SQL Server I/O Bottlenecks

“SQL Server is slow.”
We’ve all heard it. But that doesn’t always mean SQL Server is the problem. And “slow” means nothing without context and ability to verify.
More often than you’d think, poor performance is rooted in the one thing most sysadmins don’t touch until it’s on fire: the disk subsystem.
Why I/O Bottlenecks Fly Under the Radar
Many IT teams blame queries, blocking, or missing indexes when performance tanks, and sometimes they’re right. But if you’re seeing symptoms like long wait times, timeouts, or sluggish backups, there’s a good chance the underlying storage is at fault. I’ve rarely seen a storage admin agree with this at the onset of the problem, so you need to do the work up front.
Unless you look for I/O issues, you might never find them.
Common Causes of SQL Server I/O Bottlenecks
Slow or oversubscribed storage
Spinning disks, congested SANs, or underpowered SSDs can't keep up with demand.Outdated or faulty drivers
We’ve seen HBA or RAID controller driver issues that looked like database bugs.Auto-growths triggered during business hours
Small filegrowth settings lead to frequent stalls. Instant File Initialization helps this. If you cannot use IFI, manually grow your data files off-hours.Bad indexing or bloated tables
Too much data read, written, and maintained.Unused indexes
Every insert, update, or delete has to update them, whether they're used or not. This one is a killer. My script is based one my friend Pinal Dave wrote many years ago.Data, log, and tempDB all sharing a volume
A recipe for write contention and checkpoint stalls. The more separation you can do, the better. If everything is going through one controller, this might not help, especially in a VMWare virtual controller configuration.VM storage contention or thin provisioning
Your VM’s dedicated storage might not be as dedicated as you think. Check with your admin to see if VMs have moved around and you are now in a “noisy neighbor” situation.
What Do “Good” Disk Numbers Look Like?
If you're not sure what “normal” looks like for your disks, here are some rough benchmarks:
Metric | Fidget Spinners | SSD | NVMe SSD |
Read latency | 10–20 ms | 1–2 ms | < 1 ms |
Write latency | 10–30 ms | 2–4 ms | < 1 ms |
Throughput (MB/sec) | ~100–200 | 500+ | 2000+ |
IOPS (4K reads) | ~100–150 | ~10K | 100K+ |
You can get these numbers using:
Performance Monitor (Avg. Disk sec/Read, Disk Queue Length)
Disk benchmarking tools like CrystalDiskMark (local test environments)
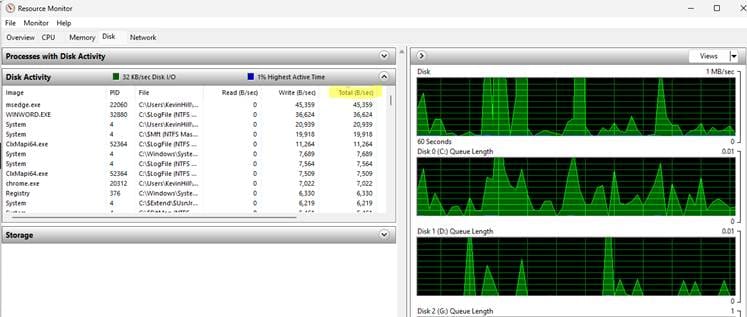
Resource Monitor>>Disk tab is a quick and easy way to see visually what the disks are spinning time on, if you are on the server.
Fixes and Workarounds
Identify and reduce high physical reads
These indicate SQL Server is constantly pulling data from disk, which could be caused by poor indexing, insufficient memory, or queries reading too much data. sp_BlitzCache from Ozar can help with this. Use @SortOrder = ‘reads’ or ‘avg reads’. Sp_whoisactive can help if the issue is ongoing.Tune queries with high reads reads
Even if a query runs from memory, it can churn the buffer pool and evict useful pages, leading to other queries hitting disk more often.Set reasonable autogrowth sizes
Growing in 1MB chunks? That’s going to hurt. Aim for larger, consistent growth settings, especially for TempDB and transaction logs.Move files to better storage
Separate data, logs, TempDB, and backups if possible. SSDs or NVMe where it counts.Clean up unused indexes
If they’re not used for reads, they’re just extra write overhead. Especially your audit and logging tables that rarely get queried.Keep your drivers and firmware current
Storage vendors quietly fix performance bugs all the time.Monitor your VM host’s disk utilization
Especially in shared environments. Noisy neighbors can take you down.
The Bottom Line:
SQL Server does a lot of things right, but it can’t make slow storage go faster. Verify the storage is the likely culprit before you go yell at the storage admin.
Before you throw more CPU or memory at a problem, take a closer look at your I/O path. You might just find the real bottleneck isn’t SQL Server at all.
New Pocket DBA® clients get the first month FREE!
Book a call, and mention “Newsletter”
SQL tidBIT:
Want to see which files are dragging down your instance?
-- This is code from the internet, verify before you run

SELECT
    DB_NAME(vfs.database_id) AS database_name,
    mf.name AS file_name,
    mf.physical_name,
    vfs.num_of_reads,
    vfs.io_stall_read_ms,
    vfs.num_of_writes,
    vfs.io_stall_write_ms,
    cast((vfs.io_stall_read_ms / (1.0 + vfs.num_of_reads)) as int)AS avg_read_ms,
    cast((vfs.io_stall_write_ms / (1.0 + vfs.num_of_writes)) as int) AS avg_write_ms
FROM sys.dm_io_virtual_file_stats(NULL, NULL) AS vfs
JOIN sys.master_files AS mf
    ON vfs.database_id = mf.database_id AND vfs.file_id = mf.file_id
ORDER BY avg_read_ms DESC;
Reply